Status Central is a comprehensive Ops tool that integrates third-party service status monitoring with customized fault notification pages. It is designed to address the pain points of modern organizations that rely on a large number of SaaS and cloud infrastructures (e.g. AWS, GitHub, Slack, Stripe, etc.) and struggle to centralize the health of their external dependencies. With Status Central, users can view the real-time operational status of all key services in one unified dashboard aggregation, eliminating the need to access dozens of separate status pages. At the same time, it allows organizations to quickly build branded external status pages that transparently demonstrate the availability of their products to customers. Whether it's for internal monitoring of the stability of external dependencies or for external maintenance announcements, Status Central provides a full range of support from real-time monitoring, alarm notification to incident review, helping teams to reduce information asymmetry and improve O&M responsiveness and customer trust.
Function List
- Multi-source stateful aggregation monitoring: Support for adding and monitoring thousands of leading SaaS services (e.g. Google Cloud, Notion, Zoom, etc.) in real time.
- Customized status page hostingProvides a visual editor, zero code to build a branded Status Page for your business, and support for custom logos and color schemes.
- Real-time fault alarms: When a subscribed external service (e.g., a region of AWS) is interrupted or downgraded, the system sends instant notifications via email and other channels.
- Incident management systemProvides a complete incident lifecycle management tool that supports the creation of incident investigations, publishing real-time updates, displaying recovery progress and generating after-action review reports.
- Custom Domain Support: Support binding enterprise-owned domain name (CNAME), to enhance the professional image of external services.
- Historical Availability Display: Automatically record and display the service's historical uptime (Uptime) and past incident history to build user trust.
- Private vs. public access control: Create both transparent status pages for the public and private monitoring dashboards that are accessible only to internal teams.
- Dependency tracking: Clearly organizes state associations between its own services and third-party services through intelligent filtering and dependency management.
Using Help
Status Central Quick Start and In-Depth Guide
The core value of Status Central is the “unified view”, which is both your telescope to the outside world (monitoring third-party services) and your window to your customers (hosting your own status page). The following guide will take you through the process of building an effective monitoring and notification system from the ground up.
1. Initial setup and account registration
- Registration ProcessTo get started: Visit the website and click on “Get Started”, which allows you to quickly sign up using your email address. New users usually go straight to the Free plan, which allows monitoring of a small number of core services (usually 5), just enough to get a taste of the core functionality.
- Dashboard Overview: After logging in, you will see the main console (Dashboard). The interface design is simple, mainly divided into the navigation bar on the left (including monitoring, status page, settings, etc.) and the information display area on the right.
2. Build your Aggregation Dashboard
This is Status Central's most distinctive feature, which addresses the issue of “external dependency black boxes”.
- Add Service:
- Click on the “Add Service” or “Monitor” option in the console.
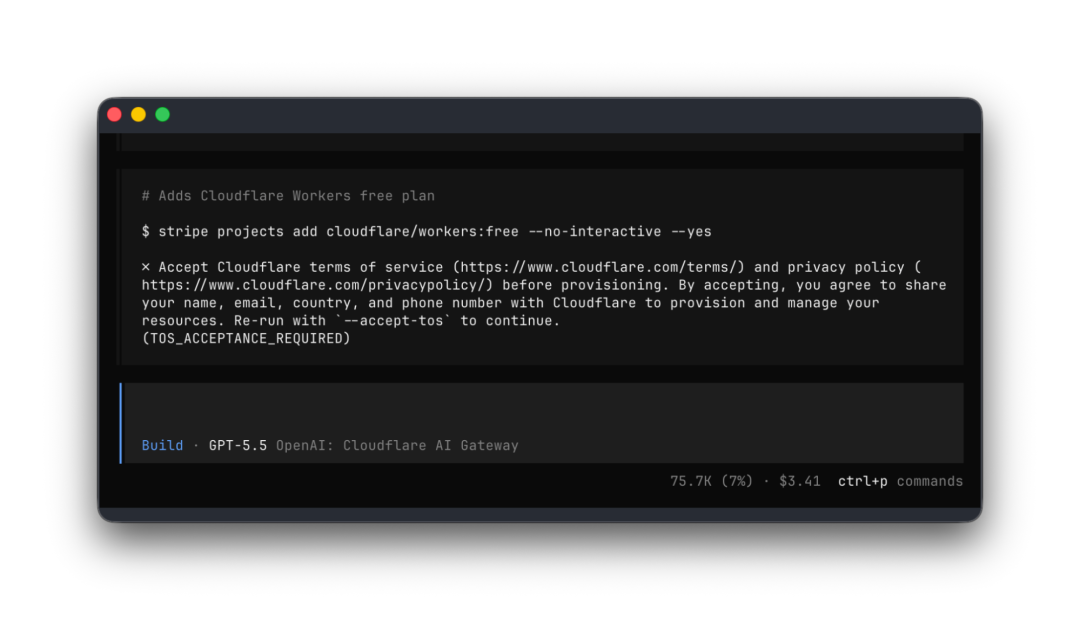
- Enter the name of the vendor you rely on in the search box, such as “GitHub”, “OpenAI” or “Cloudflare”. The system has built-in interfaces for thousands of major technology vendors.
- Select specific service components. For example, for AWS, you don't need to monitor the entire AWS, just check the box for the specific region you use (such as the
us-east-1) or specific services (e.g.EC2,S3)。 - Click to confirm the addition. At this point, the service's real-time status icon (green for normal, yellow for warning, and red for down) will be displayed directly on the front page of your dashboard.
- Setting up alarm rules:
- Go to the Notifications or Alerts settings page.
- Configure notification channels, the most basic being email notifications.Pro Edition users may support Webhook integrations for interfacing with Slack or Teams.
- Set up trigger conditions. It is recommended to check “Status Change” so that if a payment gateway you rely on (e.g. Stripe) goes down, you can receive an alert email from Status Central before your customers complain.
3. Establishment of a Status Page for external presentation
A professional official status page can effectively reduce the stress of customer service work orders when there is an issue with your own service.
- Create page:
- Click the “Status Page” module on the left menu and select “Create New Page”.
- Basic Configuration: Fill in the page name (e.g. “Acme Corp Status”), subtitle and supporting links.
- Brand Customization: Upload your business logo, set the Favicon, and adjust the main color of the page (Header color, button color, etc.) according to the brand VI.
- Add Components:
- Components are functional modules of your service, such as “API Interface”, “Web Console”, “Mobile App”, “Payment Processing Payment Processing” and so on.
- Under the Infrastructure or Components tab, click Add Component.
- It is recommended to name the servers according to functional modules rather than physical servers, so that non-technical users can understand them. For example, use “User Login Service” instead of “Auth-Server-01”.
- Binding of customized domain names:
- In the “Domain” setting, enter the sub-domain name you want to use (e.g.
status.yourcompany.com)。 - The system will provide a CNAME record value. Please go to the console of your domain name registrar (e.g. GoDaddy or Aliyun) to add this CNAME record.
- Once validated, users can access the status page through your own domain name.
- In the “Domain” setting, enter the sub-domain name you want to use (e.g.
4. Incident Management and Communication Process (Incident Management)
This is the standard operating SOP for the Ops team in the event of a failure.
- Create Incident:
- Click “Incidents” -> “Create Incident” when monitoring alarms or receiving user feedback on a fault.
- Title & Description: Use clear and concise language. For example, put “API response delayed” in the title, and “We can monitor that some user connections to the API are timing out, and the engineering team is investigating.” in the description.”
- Select Affected Components: Check specific components (e.g. “API Interface”) and manually set the status to “Major Outage” or “Degraded Performance Degraded Performance”.
- Post a notice: Click on “Publish”. If you have subscription enabled, customers who have subscribed to your status page will be notified.
- Update progress:
- Continuously update the incident status as the troubleshooting progresses. For example, “Database deadlock issue has been localized, restarting the instance is in progress.”
- Status flow: from “Investigating” -> “Identified” -> “Monitoring ” -> “Monitoring” -> "Resolved".
- review in hindsight:
- Once the failure is resolved, the system automatically records the length of this downtime and calculates it into that month's Uptime data, generating a visual history bar that proves your long-term stability to your customers.
5. Advanced techniques: transparency of dependencies
Status Central allows you to display monitored Third Party Services directly on your External Status Page.
- Operating Methods: Select Associate Monitored Third-Party Services when editing the status page component.
- scenario value: If your software crashes because AWS is down, you can show the red status of AWS directly on the status page. This clarifies to your customers that the problem is with the underlying vendor, not with the quality of your code, thus preserving your reputation in the event of force majeure.
application scenario
- SaaS Enterprise Customer Communications
Software service providers utilize Status Central to create official status pages to proactively communicate when service fluctuates, preventing customers from guessing on social media or bombarding the customer service department with work orders, and improving brand transparency. - DevOps Internal Monitoring Big Board
Ops teams aggregate the health status of AWS, Datadog, PagerDuty, and dozens of other tools on a single screen. A quick glance at the Dashboard during the morning meeting confirms that all infrastructure and dependencies are up and running. - E-commerce platform promotion guarantee
During Double 11 or Black Friday, e-commerce operations teams use Status Central to monitor the status of payment gateways (e.g., PayPal, Stripe) and CDN providers, and in the event of upstream fluctuations, the backup link is immediately activated. backup links are activated as soon as there is a fluctuation upstream. - MSP (Managed Service Provider)
Service providers that manage IT infrastructure for multiple customers utilize Status Central to monitor the cloud environments (Azure, Google Cloud) that different customers rely on and present availability reports for their proprietary services to specific customers via private status pages.
QA
- Are Status Central and Status.io the same product?
No, it's not. Despite the similarity in name and overlap in functionality, Status Central emphasizes the ability to “aggregate the status of third-party services”, i.e., displaying the status of external services such as AWS, Slack, etc., whereas Status.io focuses on being a pure “status page hosting provider”. Status Central is a one-stop solution to the problems of “looking at others” and “showing yourself”. - Can I use it for free?
Yes. Status Central offers Free plans, which typically support monitoring a limited number (e.g., 5) of services and creating basic status pages, ideal for startup teams or individual developer validation needs. - If a third-party service (e.g. GitHub) hangs, will my status page be updated automatically?
Depending on your settings, Status Central allows you to map the status of monitored third-party services to your public pages. If you turn this feature on, when GitHub hangs, the corresponding “Code Repository Storage” component on your page can automatically show an exception without manual intervention. - What notification methods are supported?
The Basic version primarily supports email notifications. Premium plans typically include Webhook support, which means you can connect it to Slack, Microsoft Teams, Discord, and even SMS gateways like Twilio for multi-channel reach. - Can I monitor my private server?
Status Central focuses primarily on status aggregation for public cloud SaaS services (via official APIs or status page crawls). For monitoring of your private servers (e.g. CPU, memory), it is often recommended to use Datadog or Prometheus and then manually update the status via Status Central's API or components, or see if there are specific Agent integrations supported.