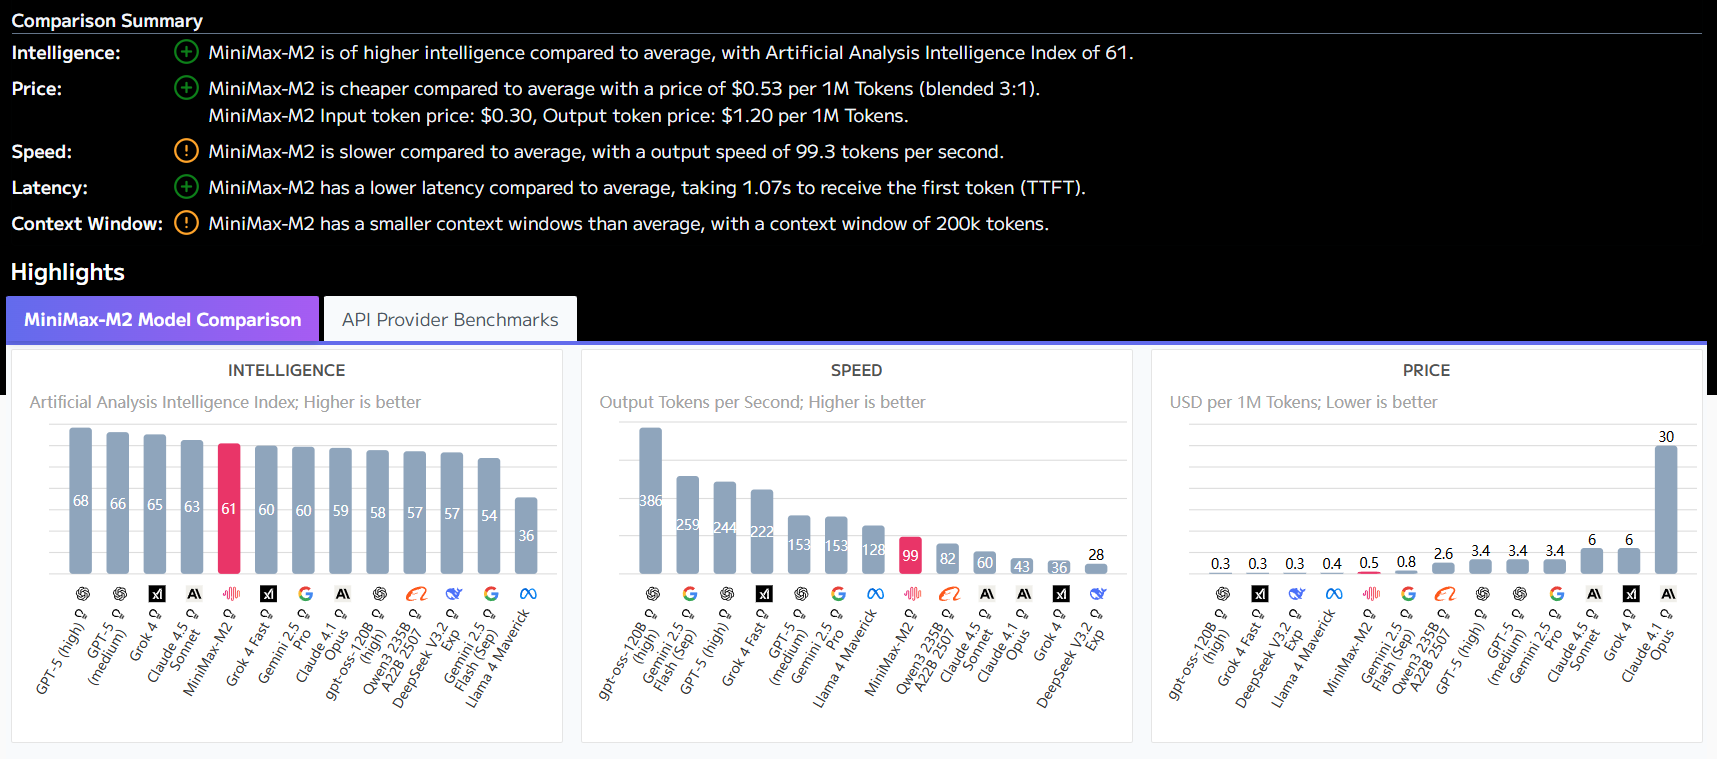
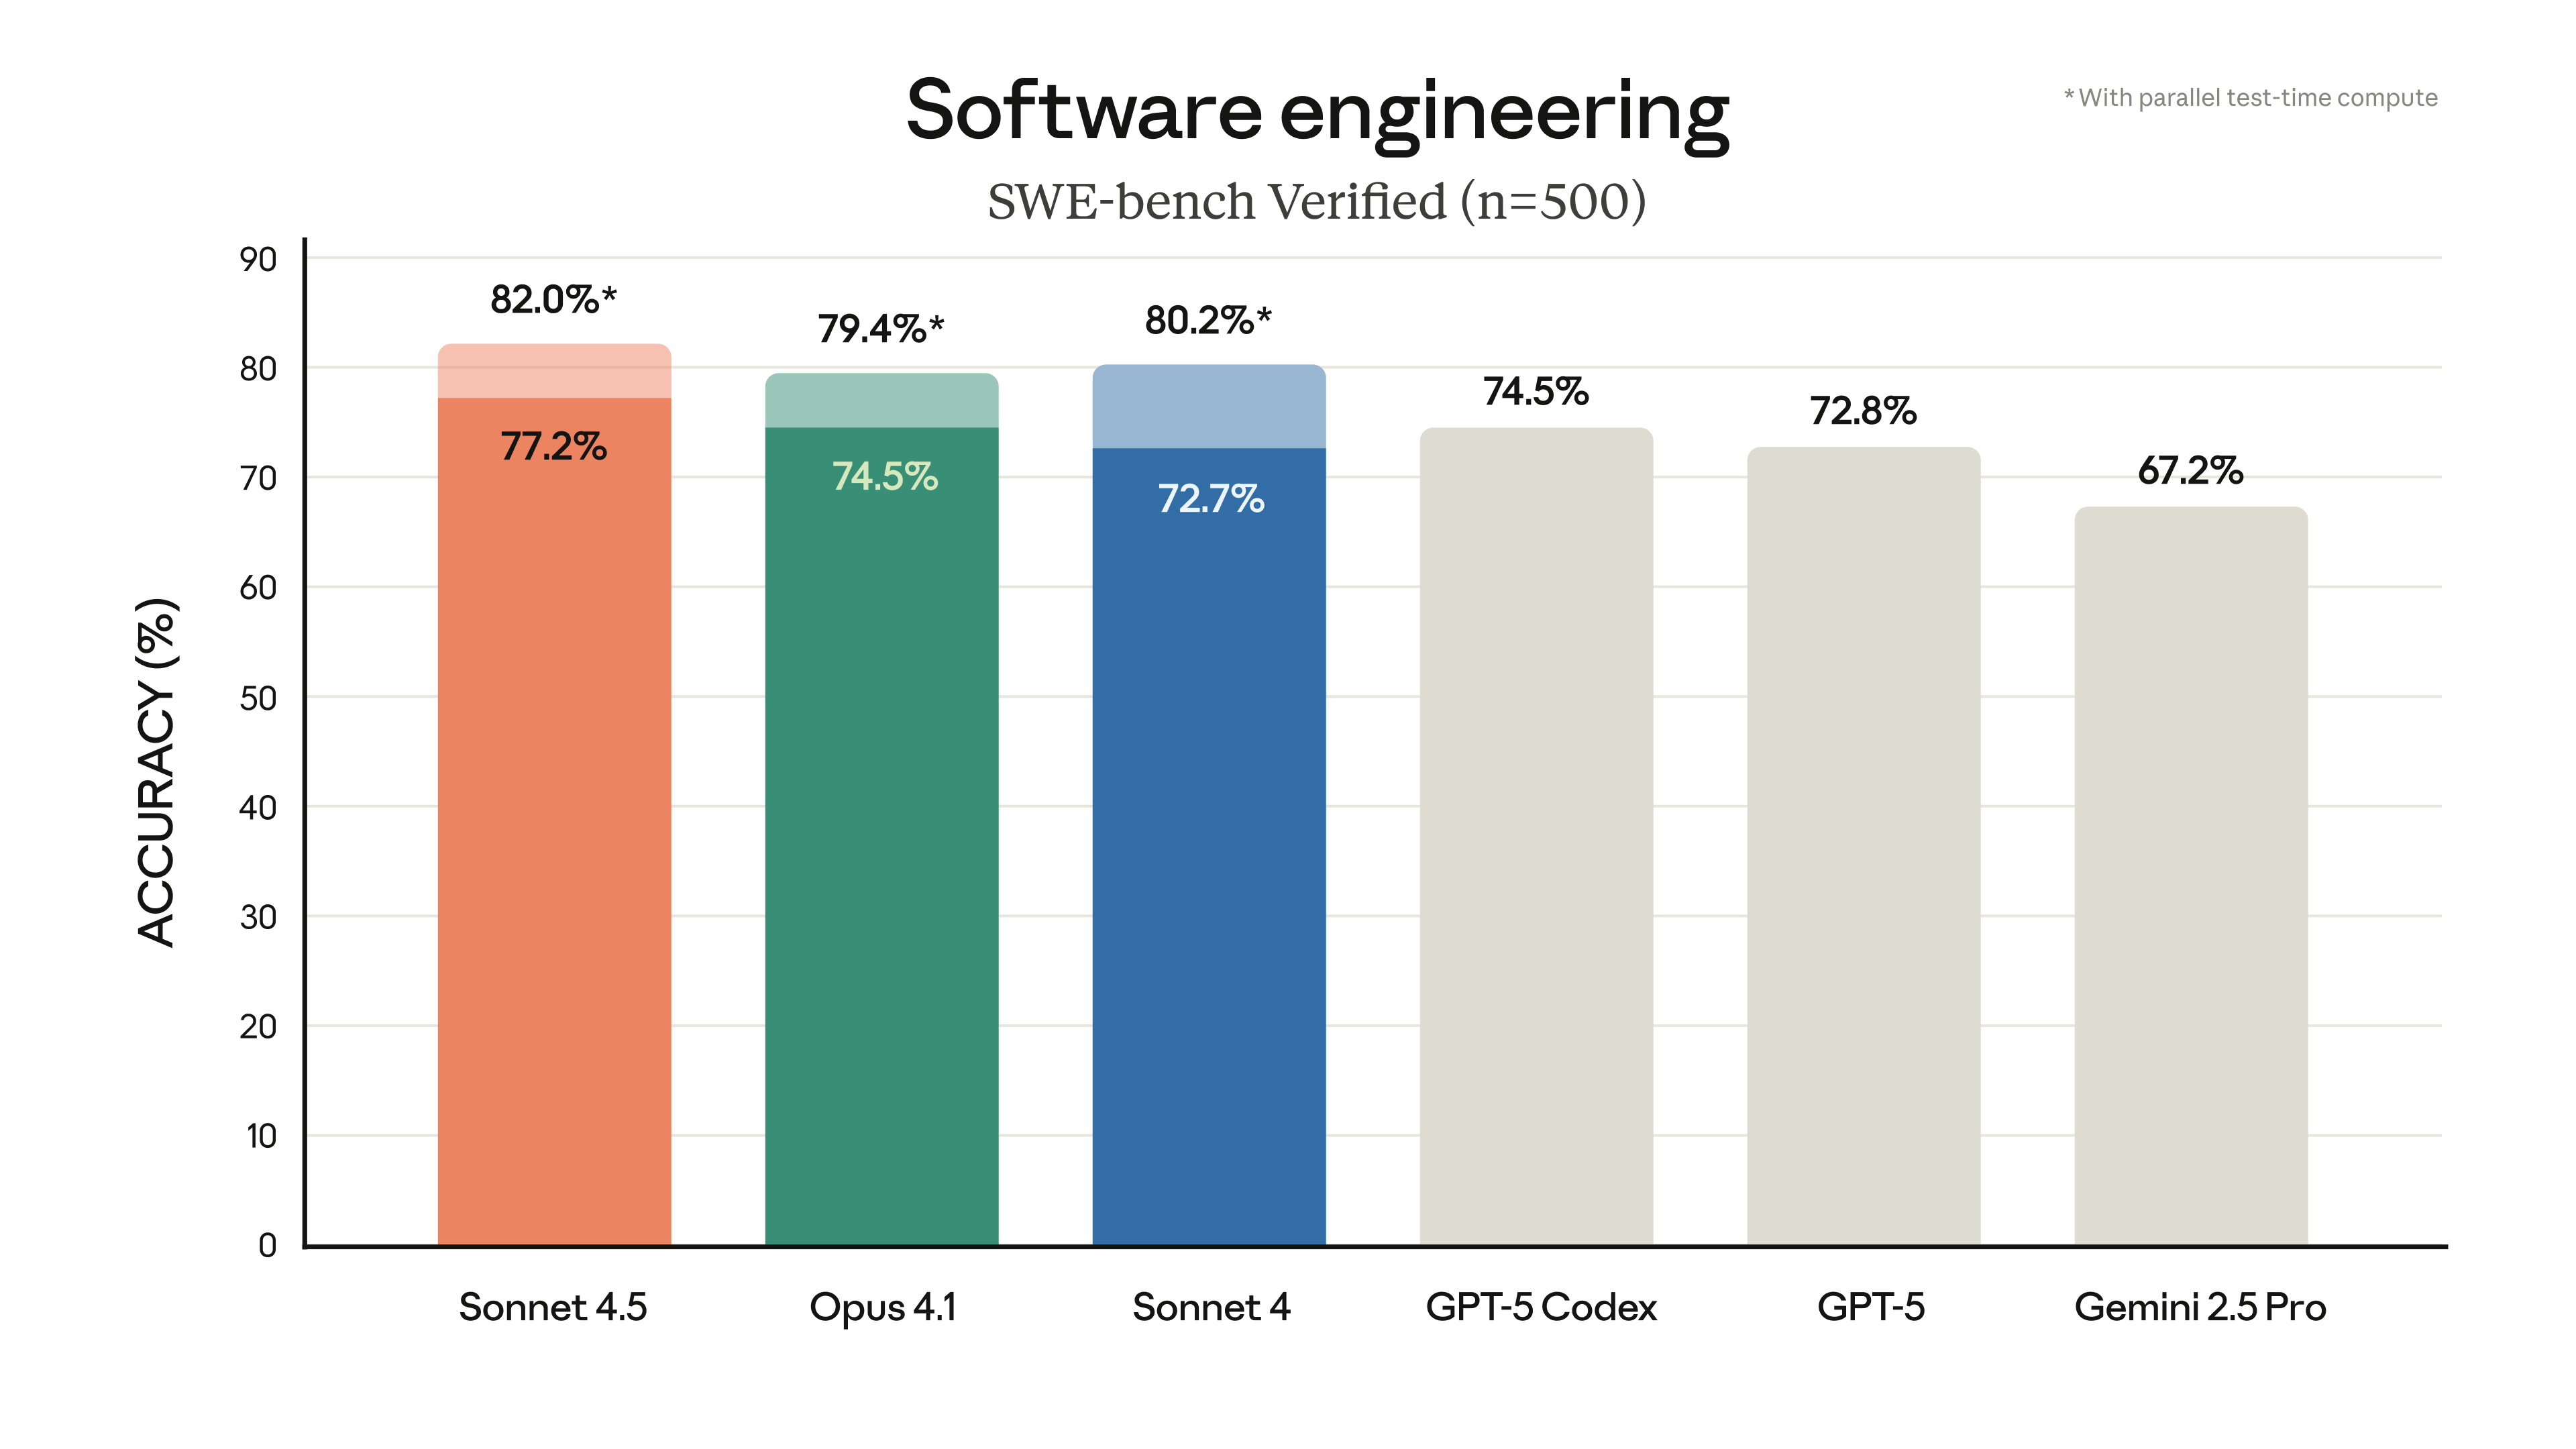
mcp-echarts is particularly suitable for automated report generation scenarios in practical applications, which can efficiently transform data analysis results into visualization content. In this workflow, the system first completes the data analysis, and then calls the mcp-echarts service to dynamically convert the key data points and analysis conclusions into various types of ECharts charts, which are ultimately embedded in the generated report document. This automated visualization process not only improves the efficiency of report production, but also ensures the professionalism and accuracy of the charts.
The scenario mcp-echarts brings three core values:
- Responsiveness: localized rendering ensures millisecond chart generation times
- Design consistency: maintain a consistent style across all report charts through predefined themes
- Format diversity: supports both image export and configuration file output to meet the needs of different format reports
In practice, the combination of MinIO storage can further optimize the report generation performance, especially when a large number of charts need to be processed or the report content is frequently updated, the URL reference method can significantly reduce the system resource consumption.
This answer comes from the articleMCP ECharts: MCP tool for generating ECharts visualization chartsThe


