Technical Architecture of Performance Monitoring System
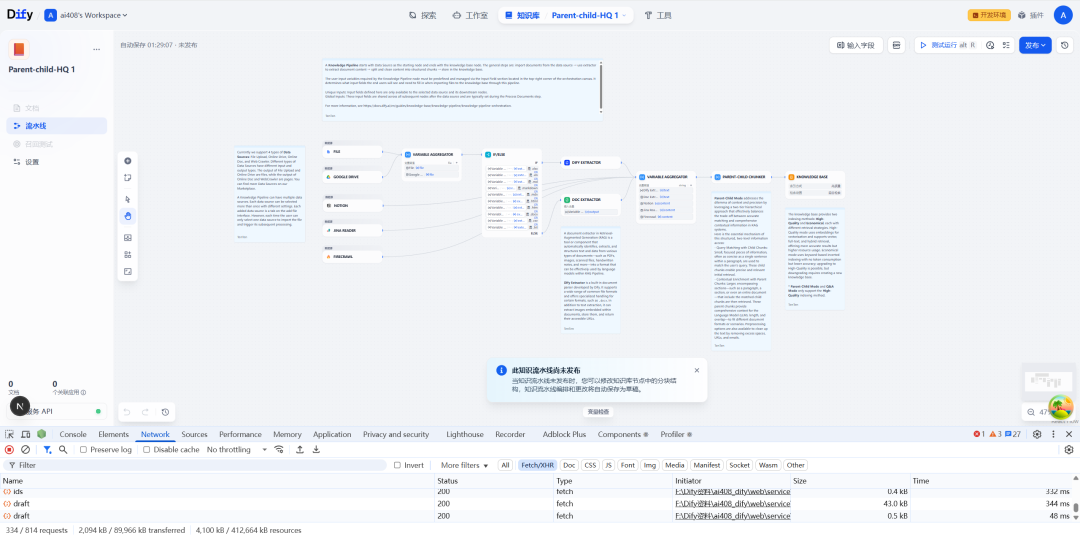
Claudia's dashboard module reconfigures the AI development monitoring experience. Its data collection layer captures CPU/memory/network metrics in real-time via Rust native extensions, the transport layer uses WebSocket to ensure second-by-second updates, and the display layer uses the React visualization library to generate interactive charts. The specially designed cost estimation algorithm combines API call frequency and model size to accurately predict cost fluctuations. Tests show that this solution reduces system overhead by 80% compared to traditional command line monitoring and supports monitoring resource consumption of 3 parallel tasks simultaneously.
- Memory leak detection accuracy of 95% or more
- Network Traffic Distinctive Upload/Download Dimension Statistics
- Abnormal consumption automatically triggers threshold alarms
This answer comes from the articleClaudia: GUI tool for managing Claude CodeThe
May not be reproduced without permission:AI productivity tools " Real-Time Dashboards Take Claude Code's Resource Monitoring to a Qualitative Leap Forward