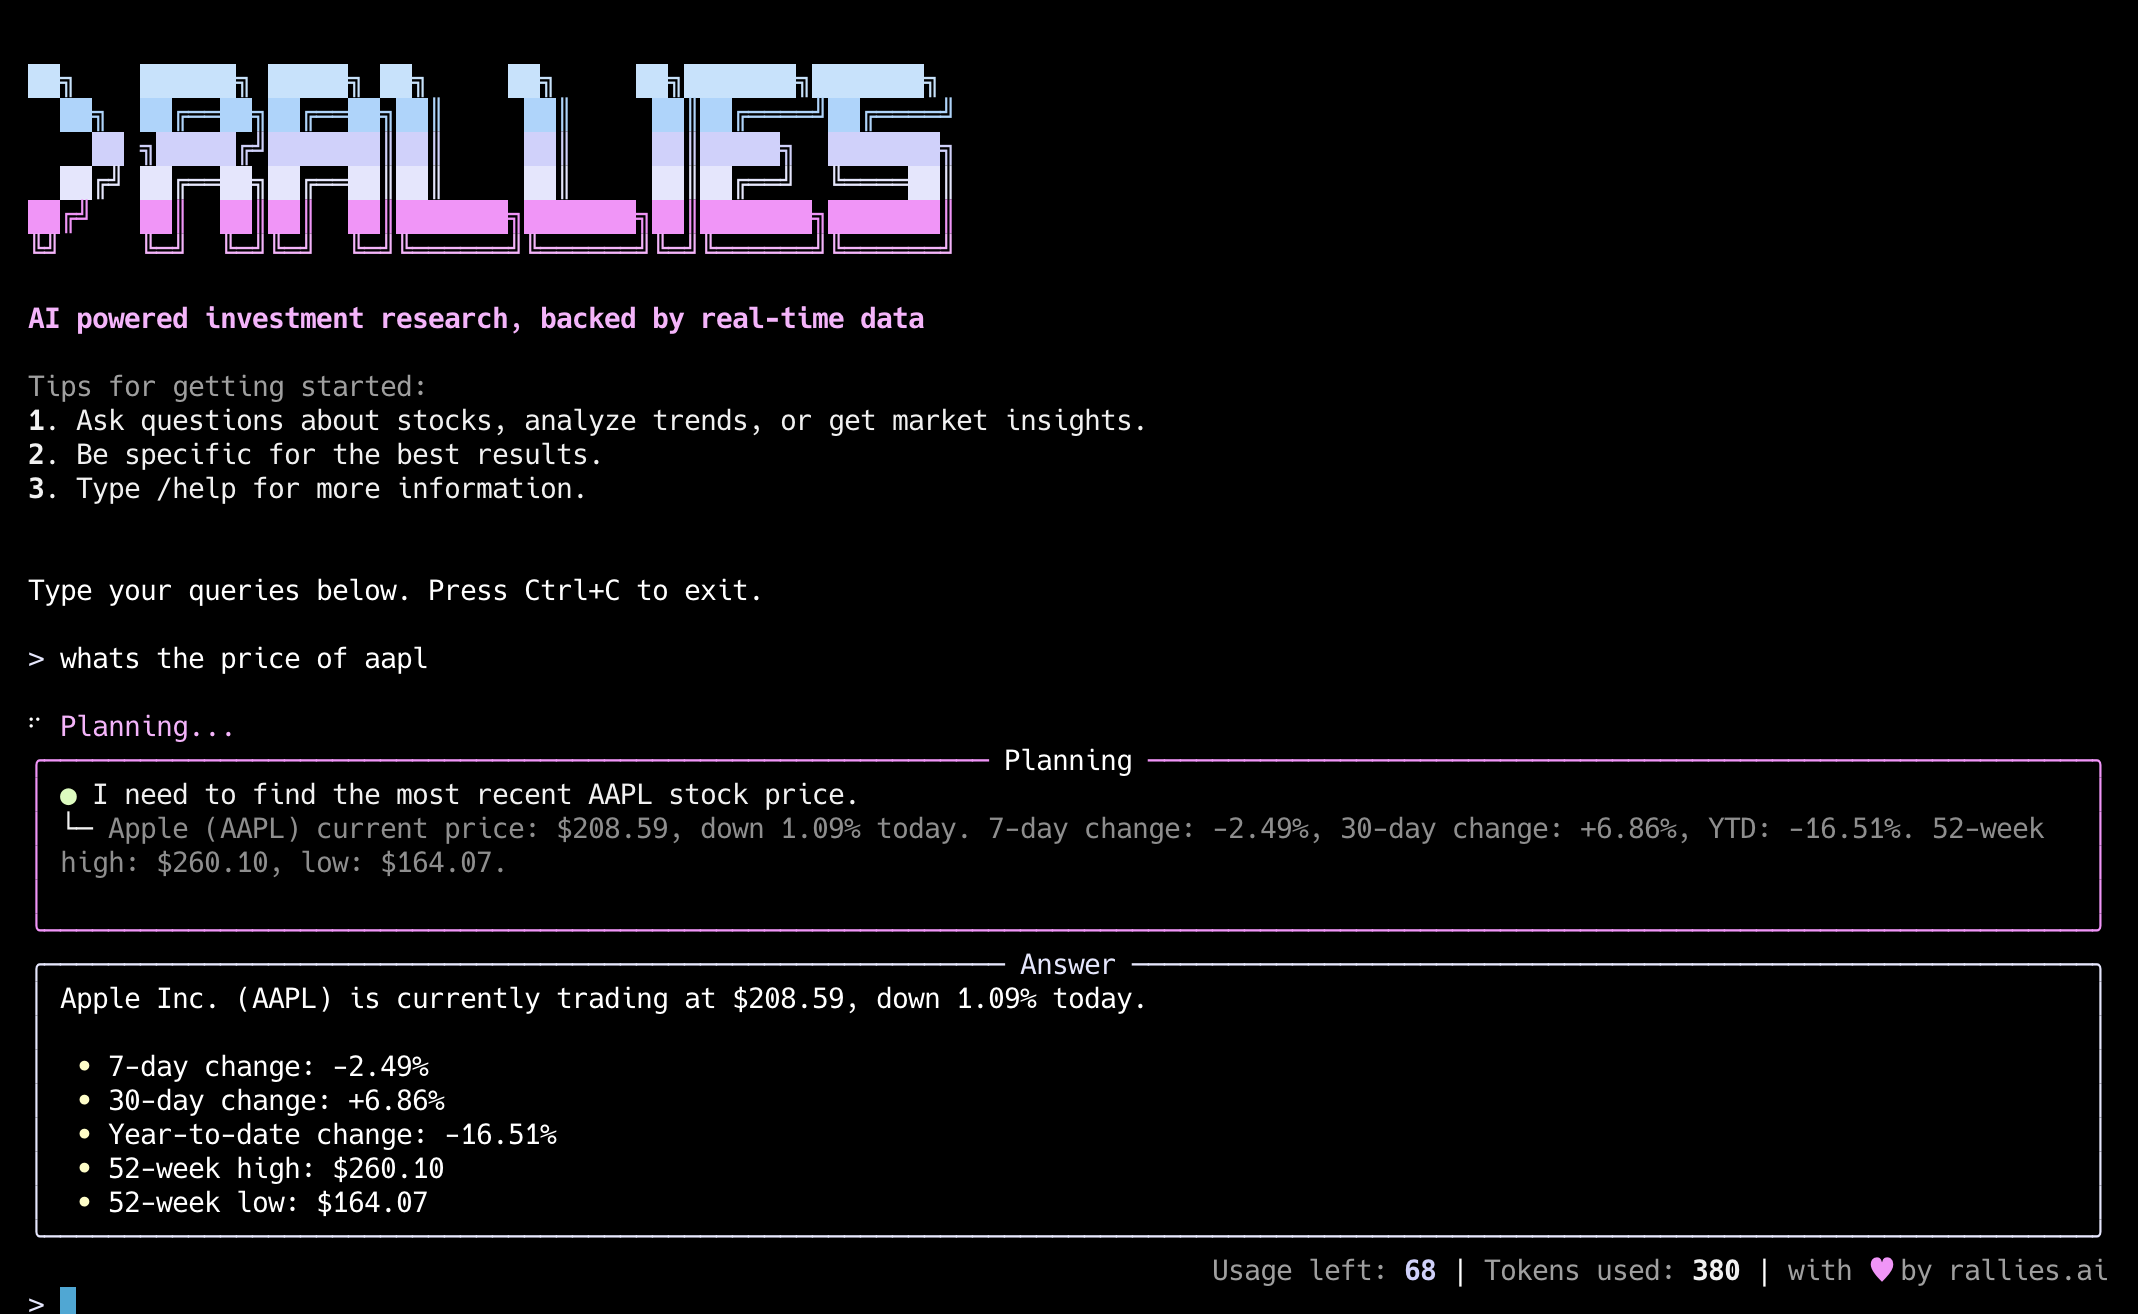
Rallies-CLI is an open source command line tool designed for investors and financial enthusiasts. It supports sophisticated stock and cryptocurrency analysis with real-time market data, helping users quickly access market dynamics. Users can enter simple commands at the terminal to check stock performance, technical indicators or market trends. Rallies-CLI provides more accurate and timely data analysis than other AI tools that rely on web searches. The tool supports installation from GitHub source code for users familiar with command line operations. Its open source nature allows developers to contribute code and enhance functionality.
Function List
- Get real-time updates on stocks and cryptocurrencies.
- Analyze the recent performance of individual stocks, such as the stock price movements of Tesla or Apple.
- Provides analysis of technical indicators such as RSI, MACD, etc.
- Compare the performance of multiple stocks over a specific time period, such as Microsoft vs. Google on a quarterly basis.
- Look for market hotspots, such as the leading stocks in the technology sector.
- Recognize stock technical patterns such as the cup and handle pattern.
- Track market sentiment, such as the overall trend of cryptocurrencies.
- Get the latest earnings data or the impact of macroeconomic events on the market.
- Find oversold or overbought stocks, such as S&P 500 components.
- Support for complex queries such as option flow data analysis.
Using Help
Installation process
Rallies-CLI offers two ways of installation: from source or via PyPI. Here are the detailed steps:
Installation from source
- clone warehouse
Clone the code for Rallies-CLI locally by running the following command in a terminal:git clone https://github.com/ralliesai/rallies-cli.gitNote: Make sure you have Git installed. if not, download Git for Windows on Windows or install it on macOS/Linux via a package manager (e.g.
sudo apt install git)。 - Go to the project directory
Once the cloning is complete, go to the project folder:cd rallies-cli - Installation of dependencies
Use Python's pip to install project dependencies. Python 3.8 or higher is recommended:pip install -e .This will install Rallies-CLI and its dependencies. Make sure that your network connection is working and that pip is pointing to the correct version of Python (available in the
pip --version(Check).
Installing from PyPI
The PyPI installation is not yet officially released, but the official documentation mentions that support is coming soon. Users can check for availability by running the following command:
pip install rallies
If you are prompted that the package does not exist, follow the GitHub repository for updates and wait for the PyPI version to be released.
Verify Installation
After the installation is complete, run the following command to check for success:
rallies --version
If the version number is returned, the installation was successful.
Usage
After installation, users can enter commands to query market data directly from the terminal.Rallies-CLI is easy to operate, and analysis can be triggered by inputting natural language. Below is the detailed operation flow of the main functions:
Check Stock News
Users can enter commands similar to the following to obtain real-time stock information:
rallies "What's happening with AAPL today?"
- Functional Description: This order returns the day's stock price movement, trading volume and related news summary for Apple Inc (AAPL).
- procedure:
- Open the terminal.
- Type the above command and enter.
- The system returns analyzed results containing stock prices, price increases and decreases, and news.
- take note of: Network connectivity needs to be ensured and data relies on real-time market interfaces.
Analyzing individual stock performance
Check the recent performance of a stock:
rallies "Analyze Tesla's recent performance"
- Functional Description: Returns price action, key financial indicators (such as P/E ratio) and market commentary for Tesla (TSLA) for the most recent week or month.
- procedure:
- Enter a command specifying a time range (such as "last week" or "last month").
- The system generates analytical reports containing graphs and text.
- distinctiveness: Supports customized time ranges for short or long term analysis.
Compare stock performance
Compare the performance of multiple stocks:
rallies "Compare MSFT vs GOOGL over the last quarter"
- Functional Description: Compare Microsoft (MSFT) and Google (GOOGL) stock prices, earnings and key metrics for the past three months.
- procedure:
- Enter the command to specify the object and time period to be compared.
- The system returns comparison charts and data summaries.
- draw attention to sth.: Multiple stocks can be compared, and the codes are separated by "vs" in the command.
Technical Indicator Analysis
Get technical indicators for stocks:
rallies "Show me NVDA's technical indicators"
- Functional Description: Returns NVDA's technical indicators such as the Relative Strength Index (RSI), Moving Average (MA), etc.
- procedure:
- Enter the ticker symbol and "technical indicators".
- The system returns indicator data and interpretation.
- distinctiveness: Supports a wide range of indicators for technical analysis enthusiasts.
Find out what's hot in the market
Check popular stocks or sectors:
rallies "Show me top gainers in tech sector"
- Functional Description: A list of the day's leading stocks in the technology sector, including gains and trading volume.
- procedure:
- Enter the name of the sector (e.g. "tech sector").
- The system returns a list of sorted stocks.
Market Sentiment Analysis
Understanding market sentiment:
rallies "What's the market sentiment on cryptocurrency?"
- Functional Description: Analyze the overall sentiment of the cryptocurrency market based on news, social media and trading data.
- procedure:
- Enter the asset class (e.g. "cryptocurrency").
- The system returns sentiment scores and key drivers.
Earnings reports and macro events
Check for the latest earnings reports or economic events:
rallies "Latest earnings reports this week"
- Functional Description: A list of companies reporting earnings this week and their key figures.
- procedure:
- Enter a time range or event type.
- The system returns a summary of the earnings report or an analysis of the impact of the event.
caveat
- network requirement: Rallies-CLI relies on real-time data and requires a stable internet connection.
- Data accuracy: The results are based on market interfaces and are recommended to cross-check important investment decisions.
- Update Frequency: Check the GitHub repository regularly for the latest features and fixes.
application scenario
- Individual investment research
Individual investors use Rallies-CLI to quickly analyze the real-time performance of stocks or cryptocurrencies and develop buy and sell strategies. For example, check the recent trend of Tesla and combine it with technical indicators to decide whether to enter the market. - Professional trading analysis
Traders use tools to compare the quarterly performance of multiple stocks to identify market hotspots and optimize portfolios. For example, analyzing the leading stocks in the technology sector for trading opportunities. - financial education
Students or beginners learn technical indicators and market sentiment analysis with Rallies-CLI to understand financial market dynamics. For example, look up Bitcoin price fluctuations and learn about market drivers. - Developers and data analysts
Developers can customize functionality based on open source code, and analysts can extract real-time data for model training. For example, grabbing S&P 500 oversold stock data to build a quantitative strategy.
QA
- Is Rallies-CLI free?
Yes, Rallies-CLI is an open source tool, free to download and use from GitHub. However, you will need to cover the cost of your own running environment (e.g. cloud servers). - Programming experience required?
Not required. Regular users can simply install and enter natural language commands. Developers can extend the functionality programmatically. - Are the data sources reliable?
Data is derived from real-time market interfaces and is updated frequently. However, it is recommended that key investment decisions be validated in conjunction with other sources. - What operating systems are supported?
Windows, macOS, and Linux are supported, and can be run with Python and Git installed. - Can you analyze cryptocurrencies?
Can. The tool supports querying prices, sentiment and trends of cryptocurrencies such as Bitcoin or Ether.