MCP-PostgreSQL-Ops is a professional operations and monitoring tool designed for PostgreSQL databases. It provides the ability for Large Language Models (LLMs) or AI agents to interact with the database through a secure Model Context Protocol (MCP) server. The most important feature of this tool is that all operations are read-only, which ensures that performance analysis, configuration checking, and structure browsing are performed without causing any unintended modifications to the online database, guaranteeing absolute data security. The project utilizes PostgreSQL's built-in pg_stat_statements 和 pg_stat_monitor Extension plug-in that provides deep performance insights to help database administrators (DBAs) and developers quickly locate slow queries, analyze index usage efficiency, and manage database capacity. Users can ask natural language questions to execute various operation and maintenance commands, such as "query the 10 slowest SQL" or "check the number of connections to the database", making complex database management easier and more intuitive.
Function List
- Server Information and Status:
get_server_info: Get information about the PostgreSQL server version, operational status, and installed extension plug-ins.get_active_connections: View the number of active connections and session details for the current database.get_postgresql_config: Search and get PostgreSQL configuration parameters based on keywords.
- Database structure view:
get_database_list: Lists all databases and their sizes.get_table_list: Displays information about all tables in the specified database and their sizes.get_user_list: Lists all users of the database and their permissions.
- Performance Monitoring and Analysis:
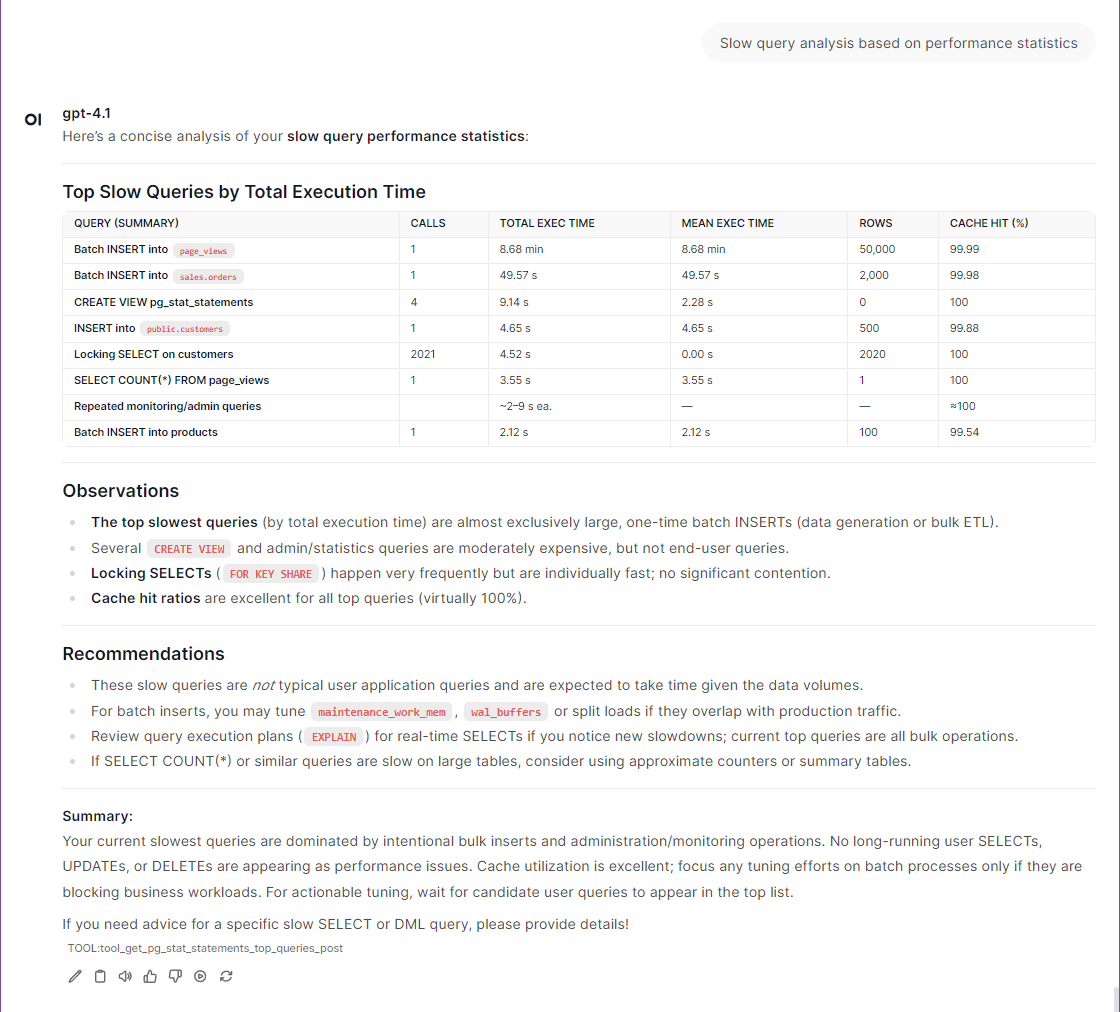
get_pg_stat_statements_top_queries: Analyze and identify slow-executing queries (slow queries) based on performance statistics.get_pg_stat_monitor_recent_queries:: Real-time monitoring of recently executed queries.get_index_usage_stats: Analyze the frequency and efficiency of index usage to help identify unused or inefficient indexes.
- capacity management:
get_database_size_info: Analyze and display the capacity size of each database.get_table_size_info: Analyze and display the size of data tables and indexes.get_vacuum_analyze_stats:: Viewing the database table'sVACUUM(garbage collection) andANALYZE(Statistical Information Update) status and history.
Using Help
The process of installing and using MCP-PostgreSQL-Ops is very straightforward and is divided into three main steps: environment preparation, installing dependencies and starting the service.
Step 1: Environment preparation and configuration
Before you start, you need to make sure that the system has installed thePython 3.11or higher, anduvThis Python package management tool.
- Download Project Code
First, clone the project from GitHub to your local computer.git clone https://github.com/call518/MCP-PostgreSQL-Ops.git cd MCP-PostgreSQL-Ops - Configuring Database Connections
The project contains a file named.env.exampleof the configuration file template. You need to copy this file and rename it.env, and then modify the database connection information inside according to your actual situation.cp .env.example .envNext, use a text editor to open the
.envfile, fill in your PostgreSQL database information:# 数据库服务器的主机名或IP地址 POSTGRES_HOST=localhost # 数据库服务器的端口 POSTGRES_PORT=5432 # 连接数据库的用户名 POSTGRES_USER=postgres # 连接数据库的密码 POSTGRES_PASSWORD=your-secret-password # 默认连接的数据库名称 POSTGRES_DB=postgres
Step 2: Install the Required PostgreSQL Extensions
In order to use the full performance monitoring feature, your PostgreSQL database must be enabled with thepg_stat_statementsExtension. This is an official extension that is usually installed by default but not enabled.
- modifications
postgresql.conf
Finding your PostgreSQL configuration filepostgresql.confinshared_preload_librariesConfiguration item to addpg_stat_statements。shared_preload_libraries = 'pg_stat_statements'If you also want to use the real-time query monitoring feature, you can add it along with the
pg_stat_monitor。shared_preload_libraries = 'pg_stat_statements,pg_stat_monitor' - Restarting database services
After modifying the configuration, the PostgreSQL service must be restarted to take effect. - Creating extensions in the database
Using a database client (such aspsql) Connect to your database and execute the following SQL command to create the extension.CREATE EXTENSION IF NOT EXISTS pg_stat_statements; -- 如果需要,也创建pg_stat_monitor CREATE EXTENSION IF NOT EXISTS pg_stat_monitor;You can do this through the program's provided
get_server_infotool to verify that the extension was installed successfully.
Step 3: Install Python dependencies and start the service
- Create a virtual environment and install dependencies
Project Recommended Useuvto manage the Python environment and dependencies, it can be installed very quickly.# 创建一个基于Python 3.11的虚拟环境 uv venv --python 3.11 # 激活虚拟环境 (在Linux/macOS下) source .venv/bin/activate # 安装所有依赖 uv sync - Starting the MCP service
The project offers several ways to start, the most common being a mode where development and testing is done locally.- Development model (recommended)
Running scripts directly, this mode launches a local MCP inspector, making it easy for you to interact directly with the tool../scripts/run-mcp-inspector-local.sh - debug mode
If you need to see more detailed logging output, you can start it directly with the Python command and set the logging level toDEBUG。python -m src.mcp_postgresql_ops.mcp_main --log-level DEBUG - HTTP service model
You can also run the service as an HTTP server so that other applications can invoke its functionality via network requests.python -m src.mcp_postgresql_ops.mcp_main \ --type streamable-http \ --host 127.0.0.1 \ --port 8080 \ --log-level DEBUGOnce the service is started, you can interact with it through the AI agent or other MCP clients, sending natural language commands to manage and monitor your database. For example, you can ask: "Show top 10 slowest queries" or "Check all database sizes".
- Development model (recommended)
application scenario
- Database Performance Bottleneck Localization
When an online application is slow to respond, DBAs or developers can immediately use this tool to query the current performance status of the database. By asking "Analyze the most resource-consuming SQL queries" or "Show recent slow queries", you can quickly pinpoint the specific SQL statements that are causing performance issues, so you can optimize them without worrying about any missteps affecting the production environment. - Daily database health patrols
DBAs can use this tool to perform routine checks on a daily basis. By querying "How many active connections are there?" , "check the size of all databases" and "which tables need to perform VACUUM?", you can have a comprehensive understanding of the database's operating status, capacity utilization and maintenance needs, to achieve proactive operation and maintenance, to prevent problems before they occur. - AI Agent Integration and Automated Operations
This tool can be integrated into the AI agent or automated operation and maintenance process. For example, set an automated task to let the AI agent query regularly every day to "check whether there are unused indexes", and if it finds useless indexes, it will automatically generate reports or alerts to help DBAs continuously optimize the database structure and reduce maintenance costs. - Data architecture and resource planning
When designing system architecture or planning capacity, development and operation teams can use this tool to understand the structure of the existing database and resource utilization. Queries such as "List size of all tables and indexes" and "View user rights list" can provide accurate data for new feature development and future server resource purchases.
QA
- Will this tool modify my database?
Absolutely not.One of the most central design principles of MCP-PostgreSQL-Ops is security. all operations are read-only. It only queries the system catalog and performance statistics views of the database and does not perform anyUPDATE、DELETE或INSERTand other write operations, and can be used in production environments with confidence. - What do I need to do to prepare my database before using this tool?
You need to make sure that the database version is PostgreSQL 12 or higher. The most important preparation is to enable thepg_stat_statementsextension, as it is the basis for the performance analysis feature. Enabling it requires modifying thepostgresql.conffile and restart the database service, as described in detail in the "Help" section. - What is MCP and how is this tool different?
MCP (Model Context Protocol) is a protocol that allows AI models to securely interact with external tools such as databases. It defines a set of rules that let the AI know what functions the tool has and how to invoke them. Unlike other tools that may allow AI to execute SQL queries directly, this tool encapsulates all operations into secure, predefined read-only functions that can only be invoked by AI and not execute arbitrary code, thus avoiding security risks such as SQL injection. - Can I use this tool on multiple database servers?
You can. You just need to modify the.envThe database connection information in the configuration file points to a different database server, and then restarting the service is sufficient. If you wish to monitor multiple servers at the same time, you can start a separate instance of the MCP-PostgreSQL-Ops service for each server.