Professional debugging toolset for developers
The extension provides a complete diagnostic tool chain for web developers:
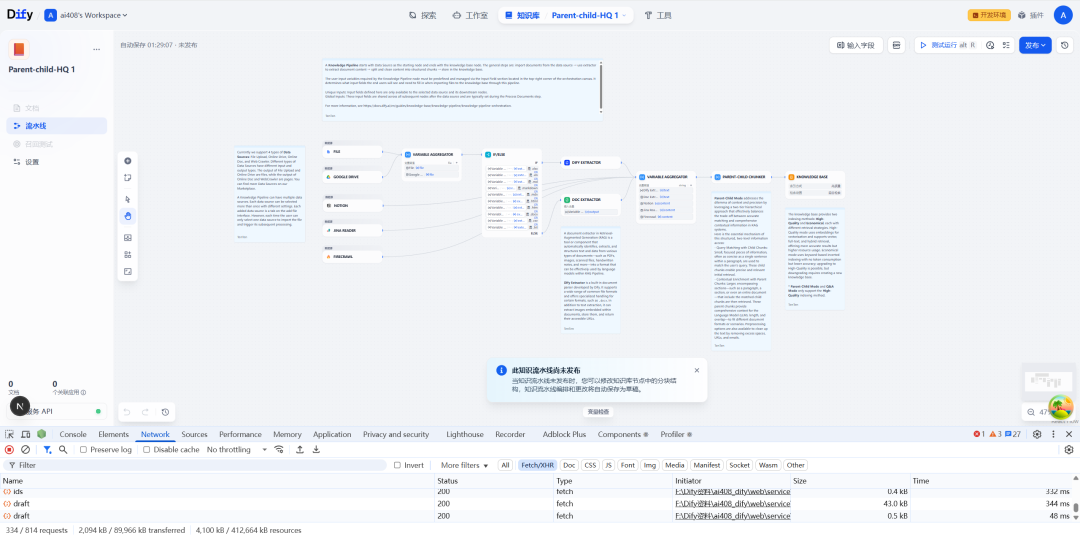
- Web Request Monitoring: Visualize the loading sequence of each resource, accurate to the millisecond level.
- Element behavior tracking: Enhanced interaction detection recognizes dynamically generated div controls.
- hot injection of scripts: Supports direct modification of runtime JavaScript without refreshing the page
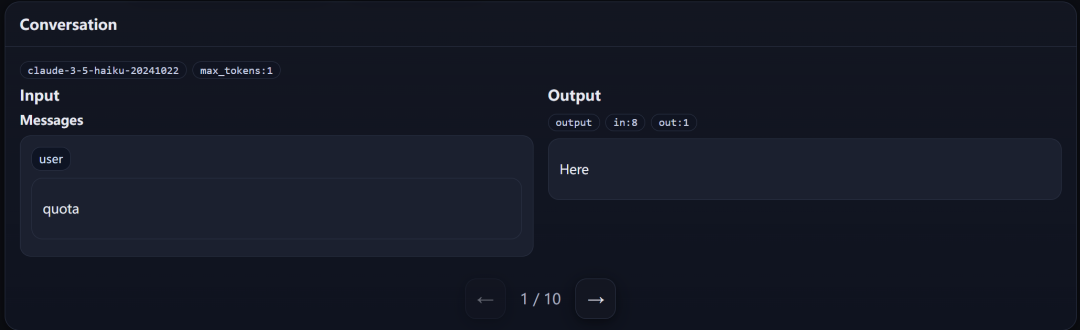
- Console mirroring: Forwarding browser Console output to AI analytics in real-time
In e-commerce website stress testing, developers can monitor the performance metrics of 5 tabs at the same time and automatically generate waterfall chart reports. Combined with the cross-tab context feature, it can quickly locate problems such as CDN anomalies or third-party script conflicts.
This answer comes from the articleChrome MCP Server: the Chrome extension that lets AI control the browser for automationThe
May not be reproduced without permission:AI productivity tools " Developer debugging scenarios are a core application area for Chrome MCP Server