Intelligent data analysis visualization engine
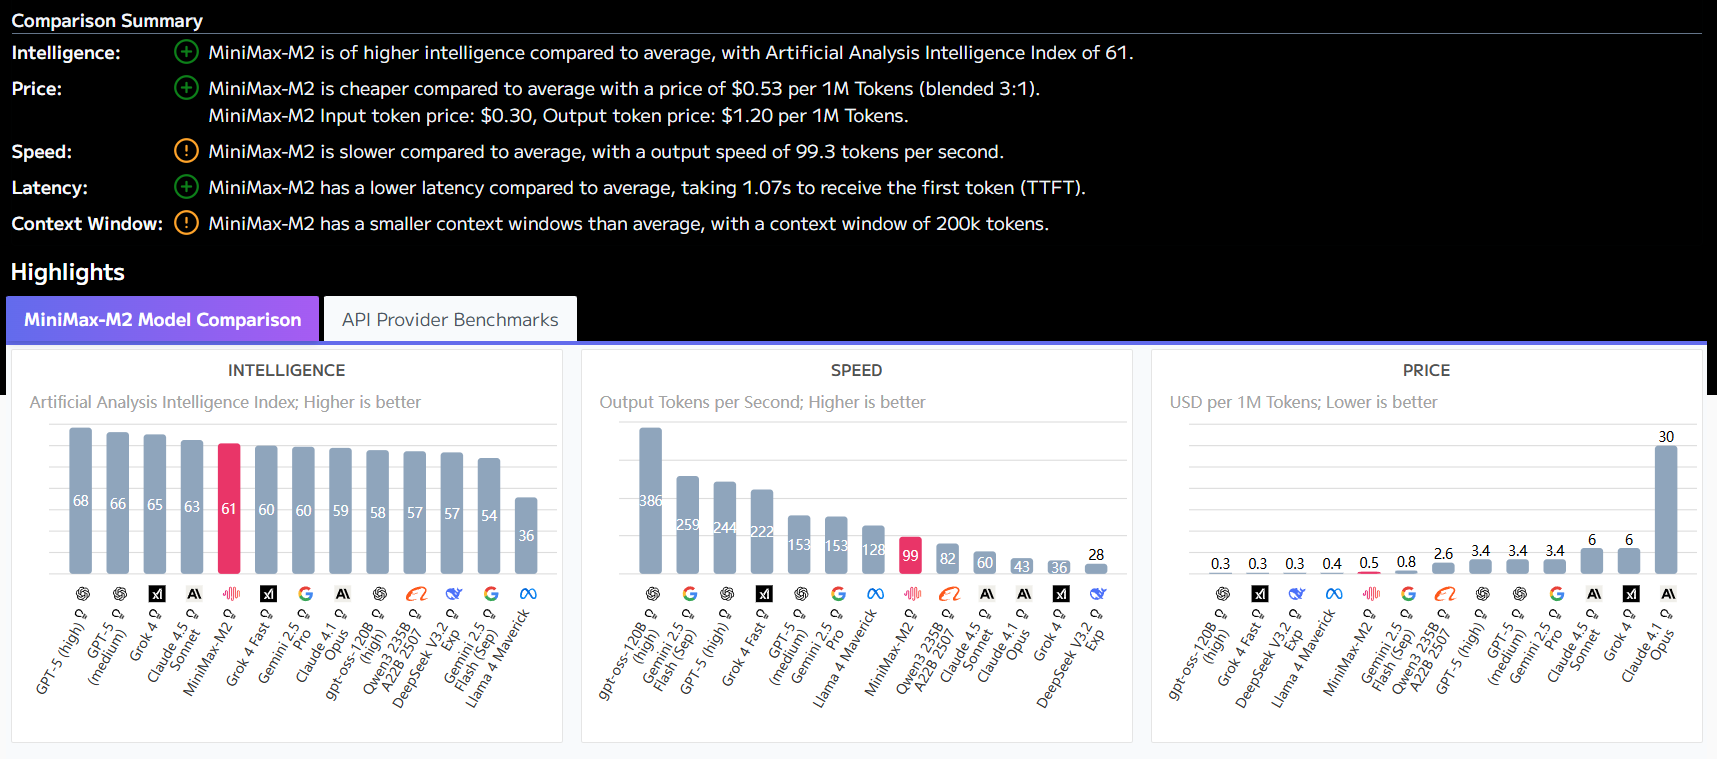
Bilbo has a powerful built-in data visualization engine that automatically transforms query results into multiple forms of professional charts.
- Support types: including bar charts, pie charts, line graphs and other mainstream business charts
- Operation Procedure: One click on the 'Visualize' button after the query is completed to generate the
- Customization options: allows adjustment of color schemes, data labels, axes and other details
- Export format: support for PNG, PDF and other standard file formats
In a typical case, the user inputs 'count the number of customers by region and display as a pie chart', and the system not only accurately understands the semantics to generate the correct data, but also automatically creates a color-coordinated 3D pie chart.
This feature is especially suitable for business report production, dramatically improving the professionalism and efficiency of data presentation.
This answer comes from the articleBilbo: a smart tool for querying and visualizing data using natural languageThe


