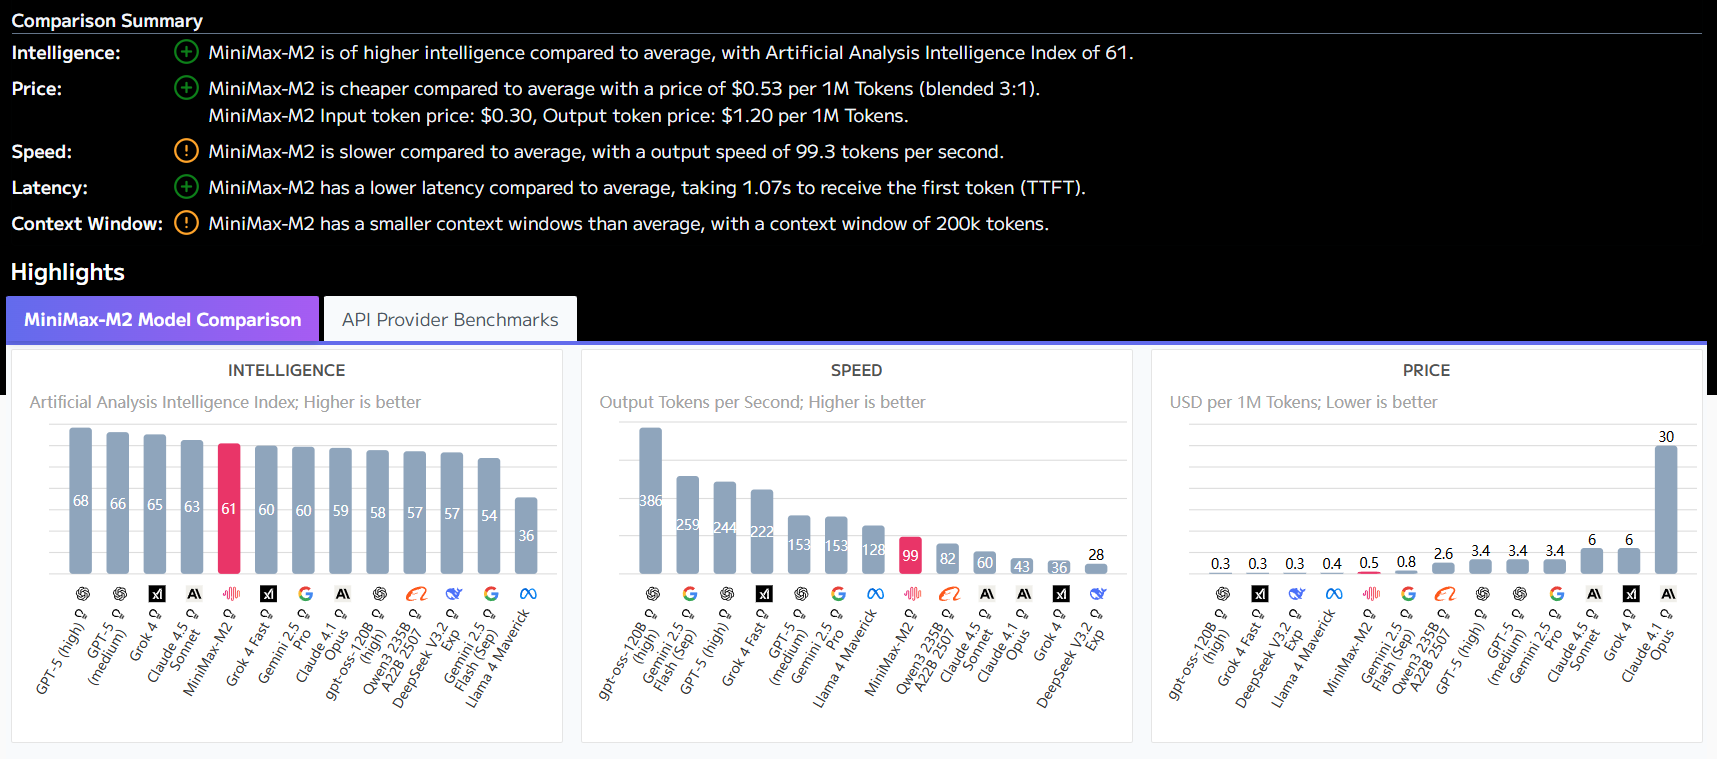
The platform's built-in professional charting engine can intelligently transform the data structure and generate pie charts, bar charts and more than 10 other visualization schemes. When studying the skin care needs of newcomers to the workplace, the system automatically extracts dimensions such as age distribution and ingredient preferences to generate interactive and dynamic charts. Users can freely switch the display format, such as converting regional sales data from tables to heat maps, or filtering consumer satisfaction curves by gender. All charts support one-click export to PNG/SVG format and retain dynamic data links, ensuring that data can still be drilled down and analyzed in Keynote and other presentation tools.
This answer comes from the articleAtypica: generating beautiful business research through long reasoningThe


